Underwriting Applications of Predictive Analytics
As predictive analytics has become more common within the insurance industry, actuaries and data scientists are often getting involved in predictive modeling projects outside of traditional pricing and reserving applications. Involvement in these projects can expand an actuary’s knowledge of the business and challenge them to address new problems. One area where actuaries have historically been consulted is in underwriting. The underwriting process typically includes the correct classification and pricing of risks as well as evaluating the acceptability of risks within an insurer’s appetite guidelines. In this article we look at a few areas where predictive analytics could potentially help insurers make better decisions in underwriting beyond pricing.
During the submission and risk selection process, insurers would like to identify customers with high profitability potential from its list of new customers, and then prioritize the quoting process to actively target those profitable customers. To achieve this goal, insurers can use historical exposure information and insurance performance as inputs from their current customers, choose a metric to be optimized such as loss ratio or combined ratio, and build a supervised model to predict this metric. In this application, robust machine-learning techniques such as gradient boosting, random forests or neutral-network can be used as a powerful tool for the prediction model given the flexibility of the techniques to account for non-linear relationship and interactions. Because prediction accuracy has the highest priority in this application, these more sophisticated modeling techniques are expected to yield the best outcome, as opposed to techniques that are easy to interpret an underperforming in prediction accuracy, such as linear regression. Insurers can then optimize its selection of customers based on the predicted metric, e.g., top 20 percent customers with lowest predicted loss ratio or combined ratio.
As an enhancement to the above application, insurers can introduce survival analysis (retention analysis) for each customer in the list, and vary the expense assumption over the analysis period (acquisition cost vs. retention cost), so that insurers can have a long-term expectance of profitability for each customer based on the likelihood of the customer staying with the insurer over time and the customer’s expected combined ratios with varying expense assumptions over time. Not only can insurers apply this model at the time of customer prospecting to target selected customers with highest profitability expectancy, they can also apply this model when quoting a customer (new or renewal) to have an indication of future profitability, which may lead to other pricing decisions, such as rate decrease for a high-value customer or nonrenewal for a low-value customer without breaching compliance requirements.
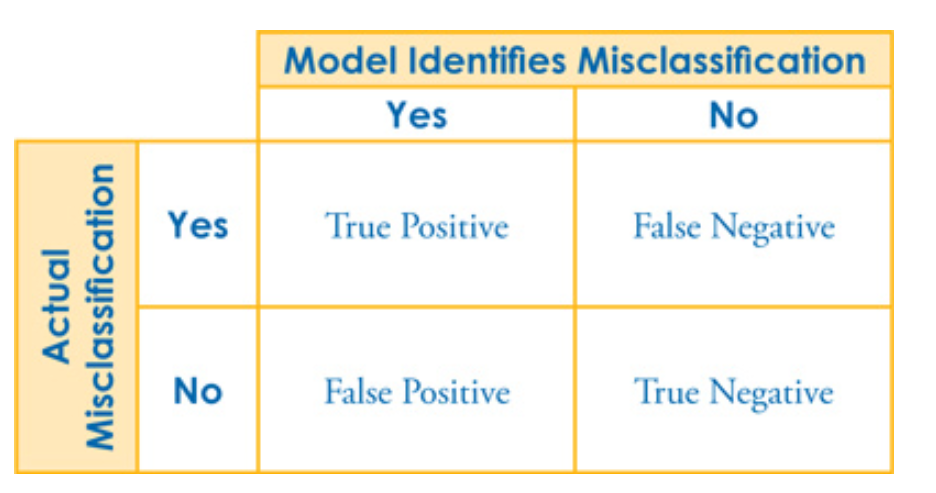
We mentioned the need to appropriately classify risks when underwriting. This can be very difficult to do for many commercial lines coverages such as general liability where the nature of different business type classifications can be somewhat nuanced but result in dramatically different risk exposure. A model to help identify accounts that are more likely to be misclassified can help the insurer focus manual review efforts on the accounts that would add the most value. This model would normally result in a binary classification of “needs review” or “does not need review” but the model output is often in the form of a score. To result in a classification of what to review, the insurer needs to choose a cutoff score to distinguish which risks to review. A useful tool to help select the cutoff where the model will deliver benefits is the confusion matrix. The costs/benefits of each of the four possible outcomes of correct versus incorrect classification can be combined to measure net benefit, with knowledge of the model accuracy at different thresholds, in order to choose a cost-effective cutoff. Even a very good model requires careful review of the threshold when the aim is to classify.
In addition to identifying the most profitable customers, an insurer needs to clearly identify those customers who potentially have exposures that are beyond what is contemplated for typical risks in the classifications an insurer is offering.
Another concern for commercial lines carriers relates to the heterogeneity of businesses even within well-defined classifications. An insurer may have a very sophisticated pricing model capturing many variables correlated with expected costs but still not have enough granularity in the models to accurately price for the specific characteristics of all applicants. In this case it is typically the role of the underwriter to review the risks for acceptability, but reviewing all policies in detail is not cost-effective. The target variable of such a model would need to be some measure of extreme loss ratio probability determined by the company’s appetite. Because there is so much heterogeneity and potentially different indicators of potential risk for each of the company’s rating classification, a typical GLM structure as used in pricing may not be appropriate. A common technique that is already well-proven in other industries and applications is to apply random forest modeling to the data. This technique combines a large number of decision tree models to avoid the typical over-fitting problem found with traditional decision trees, whereas it takes advantage of tree models to capture complex data relationship.
As with many data science problems, an important role for the actuary in the underwriting process is to help define the business objectives and costs to be considered in the models. This can include giving feedback on model effectiveness measures and target variables but may also extend to the actuary applying the modeling techniques and providing final recommendations for model implementation.